Targetin
Targetin is Bvarta’s location intelligence platform for planning, executing, and monitoring field operations.
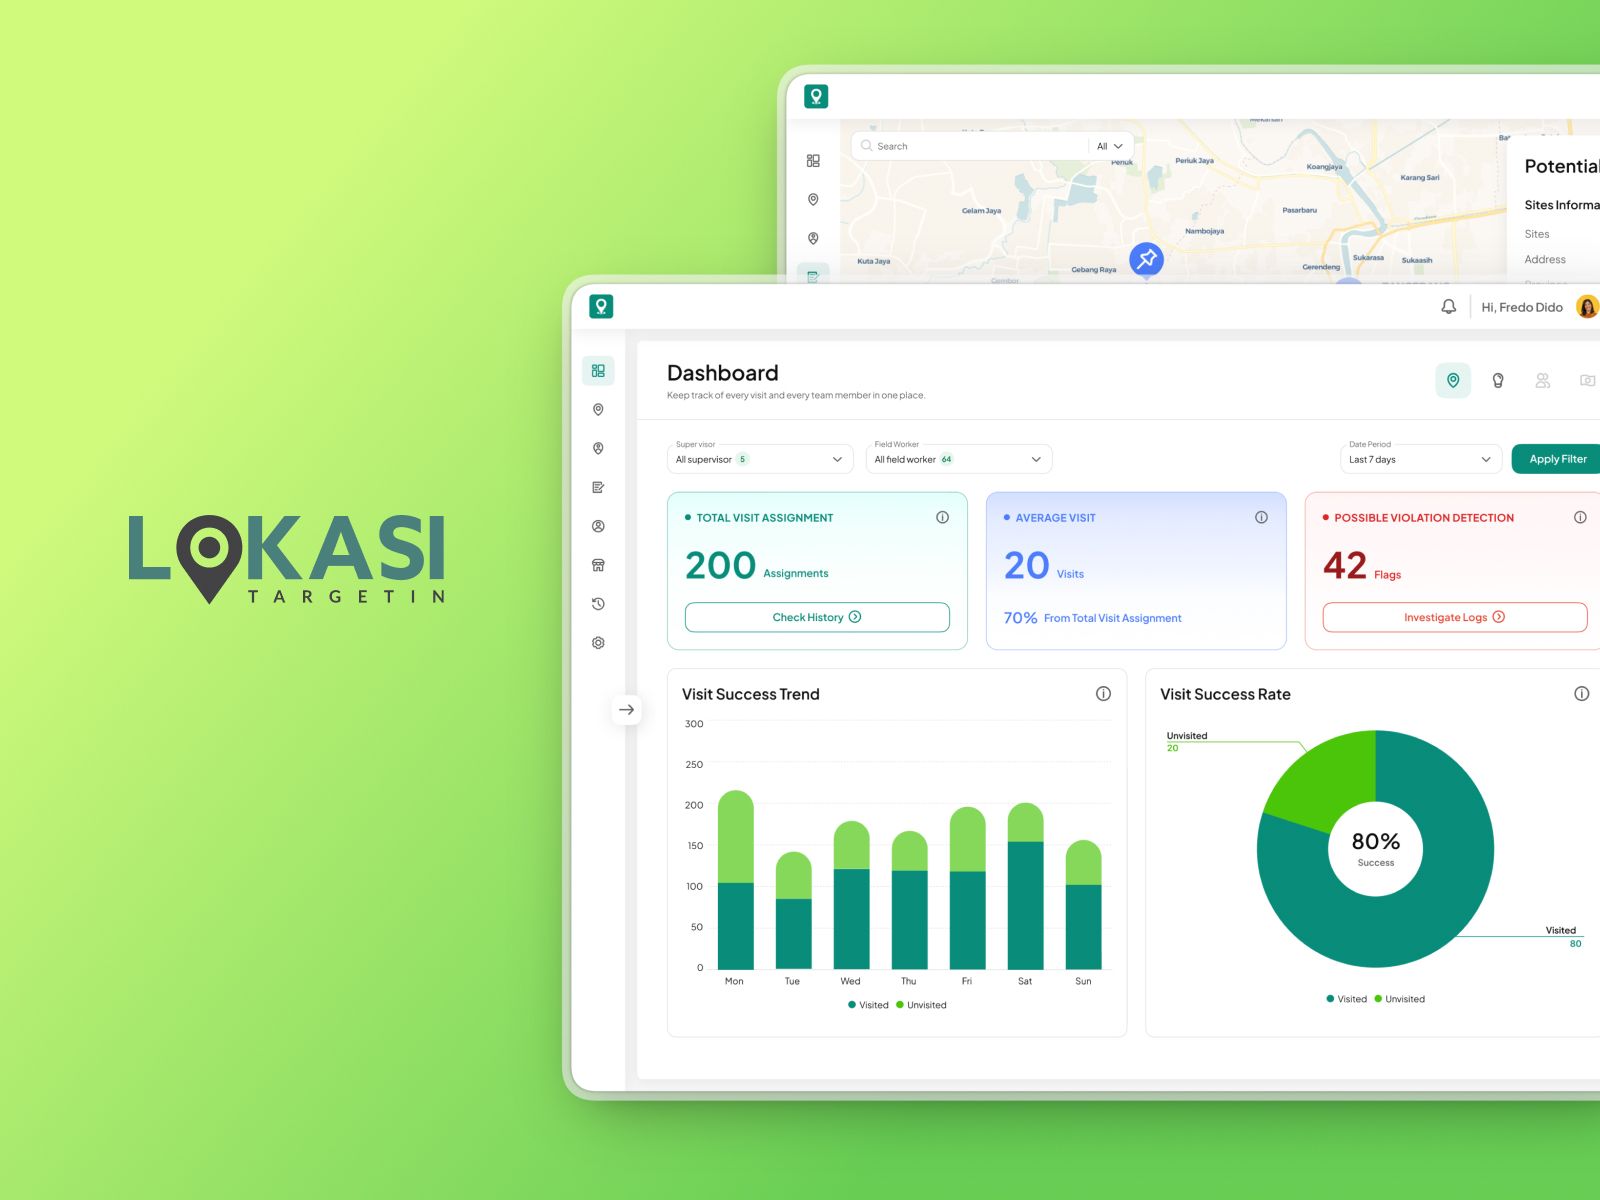
Targetin is Bvarta’s location intelligence platform for teams that manage field operations across sites, territories, and distributed workers.
For this case study, I curated two connected product areas: Assignment and Dashboard. Assignment helps supervisors plan who visits which site and when. Dashboard helps them understand whether those plans are completed, missed, or require investigation.
Project Overview
Targetin supports operational teams that need to turn location data into field activity.
A supervisor may be responsible for hundreds of sites across a territory, multiple field workers, and a schedule that changes throughout the day. Planning a visit is therefore not simply selecting a person and a date. It requires consideration of site availability, team hierarchy, territory access, visit status, workload, and potential scheduling conflicts.
The work in this case study connects two moments in that process:
- Assignment — creating and managing a field visit plan.
- Dashboard — monitoring execution, completion, and compliance after that plan has been created.
The objective was to create a connected operational experience rather than two isolated features.
The Problem
Field teams need a clear plan before they can execute work in the field. Without it, supervisors have limited control over who visits a site, whether workers are overloaded, or whether a site has already been scheduled.
The challenge became more complex because Targetin operates within a hierarchy. A user can be a supervisor to one group while also acting as a field worker for another. Permissions, available assignees, and visible data need to follow this organisational structure.
At the same time, a plan is only useful when it can be monitored. Managers need to know:
- How many visits were assigned and completed.
- Which visits were missed.
- Whether workload is distributed fairly.
- Whether a check-in may have happened outside the expected site location.
- Which operational issue needs attention first.
The product needed to support planning, execution, and monitoring as one continuous system.
My Role
As Principal UI/UX Designer at Bvarta, I led the end-to-end design work for the curated areas of Targetin.
My role included translating product requirements into workflows, defining information structure, exploring interaction models, designing high-fidelity interfaces, and preparing the experience for engineering discussion and handoff.
For Assignment and Dashboard, I focused on:
- Mapping the relationship between sites, field workers, supervisors, and visit statuses.
- Designing list, map, selection, filtering, sidebar, and detail interactions.
- Defining state behaviour for drafts, planned visits, active work, and completed records.
- Designing hierarchy-aware permissions and assignee selection.
- Handling bulk actions, scheduling conflicts, partial success, and locked records.
- Creating a functional coded prototype to communicate behaviour beyond static screens.
Design Process
Understanding the operation
I started by translating the requirements into an operational model.
The central question was simple: how does a site move from being available in the system to being planned, visited, and evaluated?
This revealed that Assignment and Dashboard needed to share the same core concepts: sites, potential sites, field workers, supervisors, dates, territories, assignment groups, and visit status.
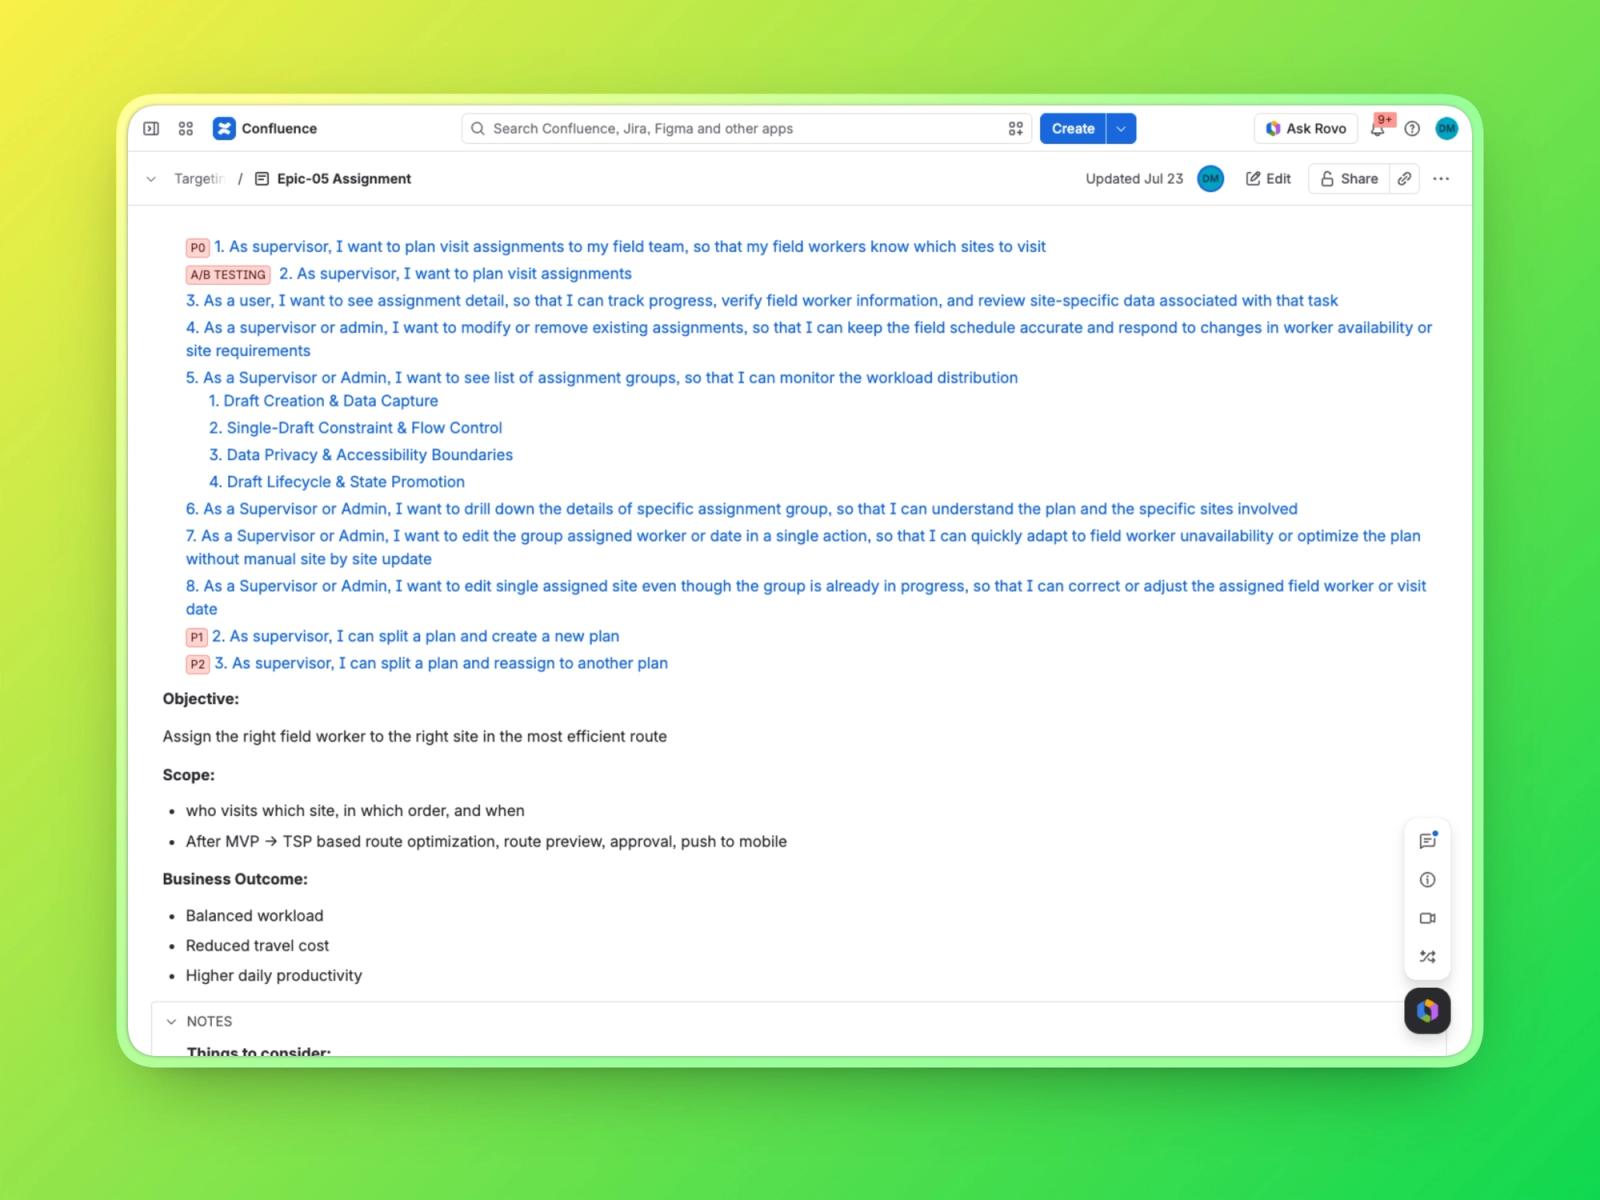
Defining the flow
I structured the experience around a simple operational loop:
Plan → Assign → Execute → Monitor → Adjust
Assignment supports the first two stages. The Dashboard supports monitoring after work reaches the field. Adjustment remains possible only while it does not compromise the validity of an active or completed visit.
This model provided a clear foundation for both product areas and reduced the risk of conflicting status behaviour between modules.
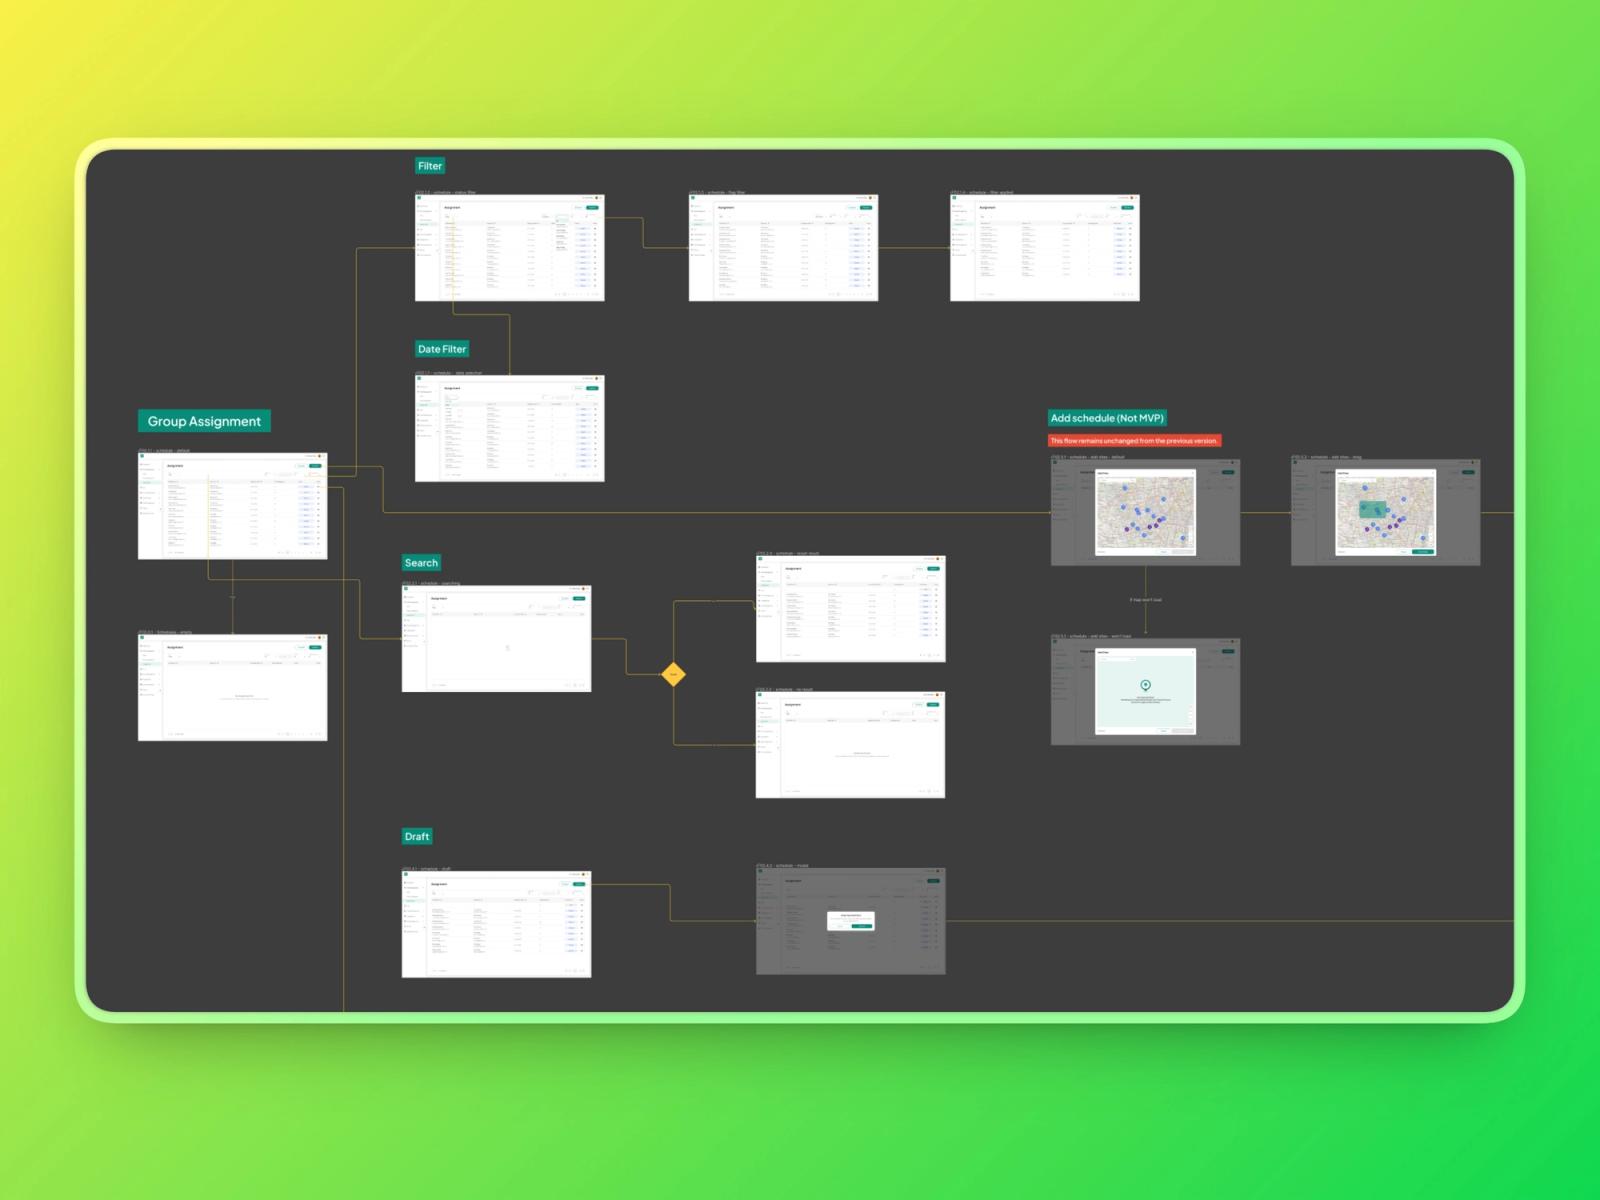
Expanding real-world states
The initial requirements contained many valid but separate scenarios. I expanded these into screen-level flows and decision points, including:
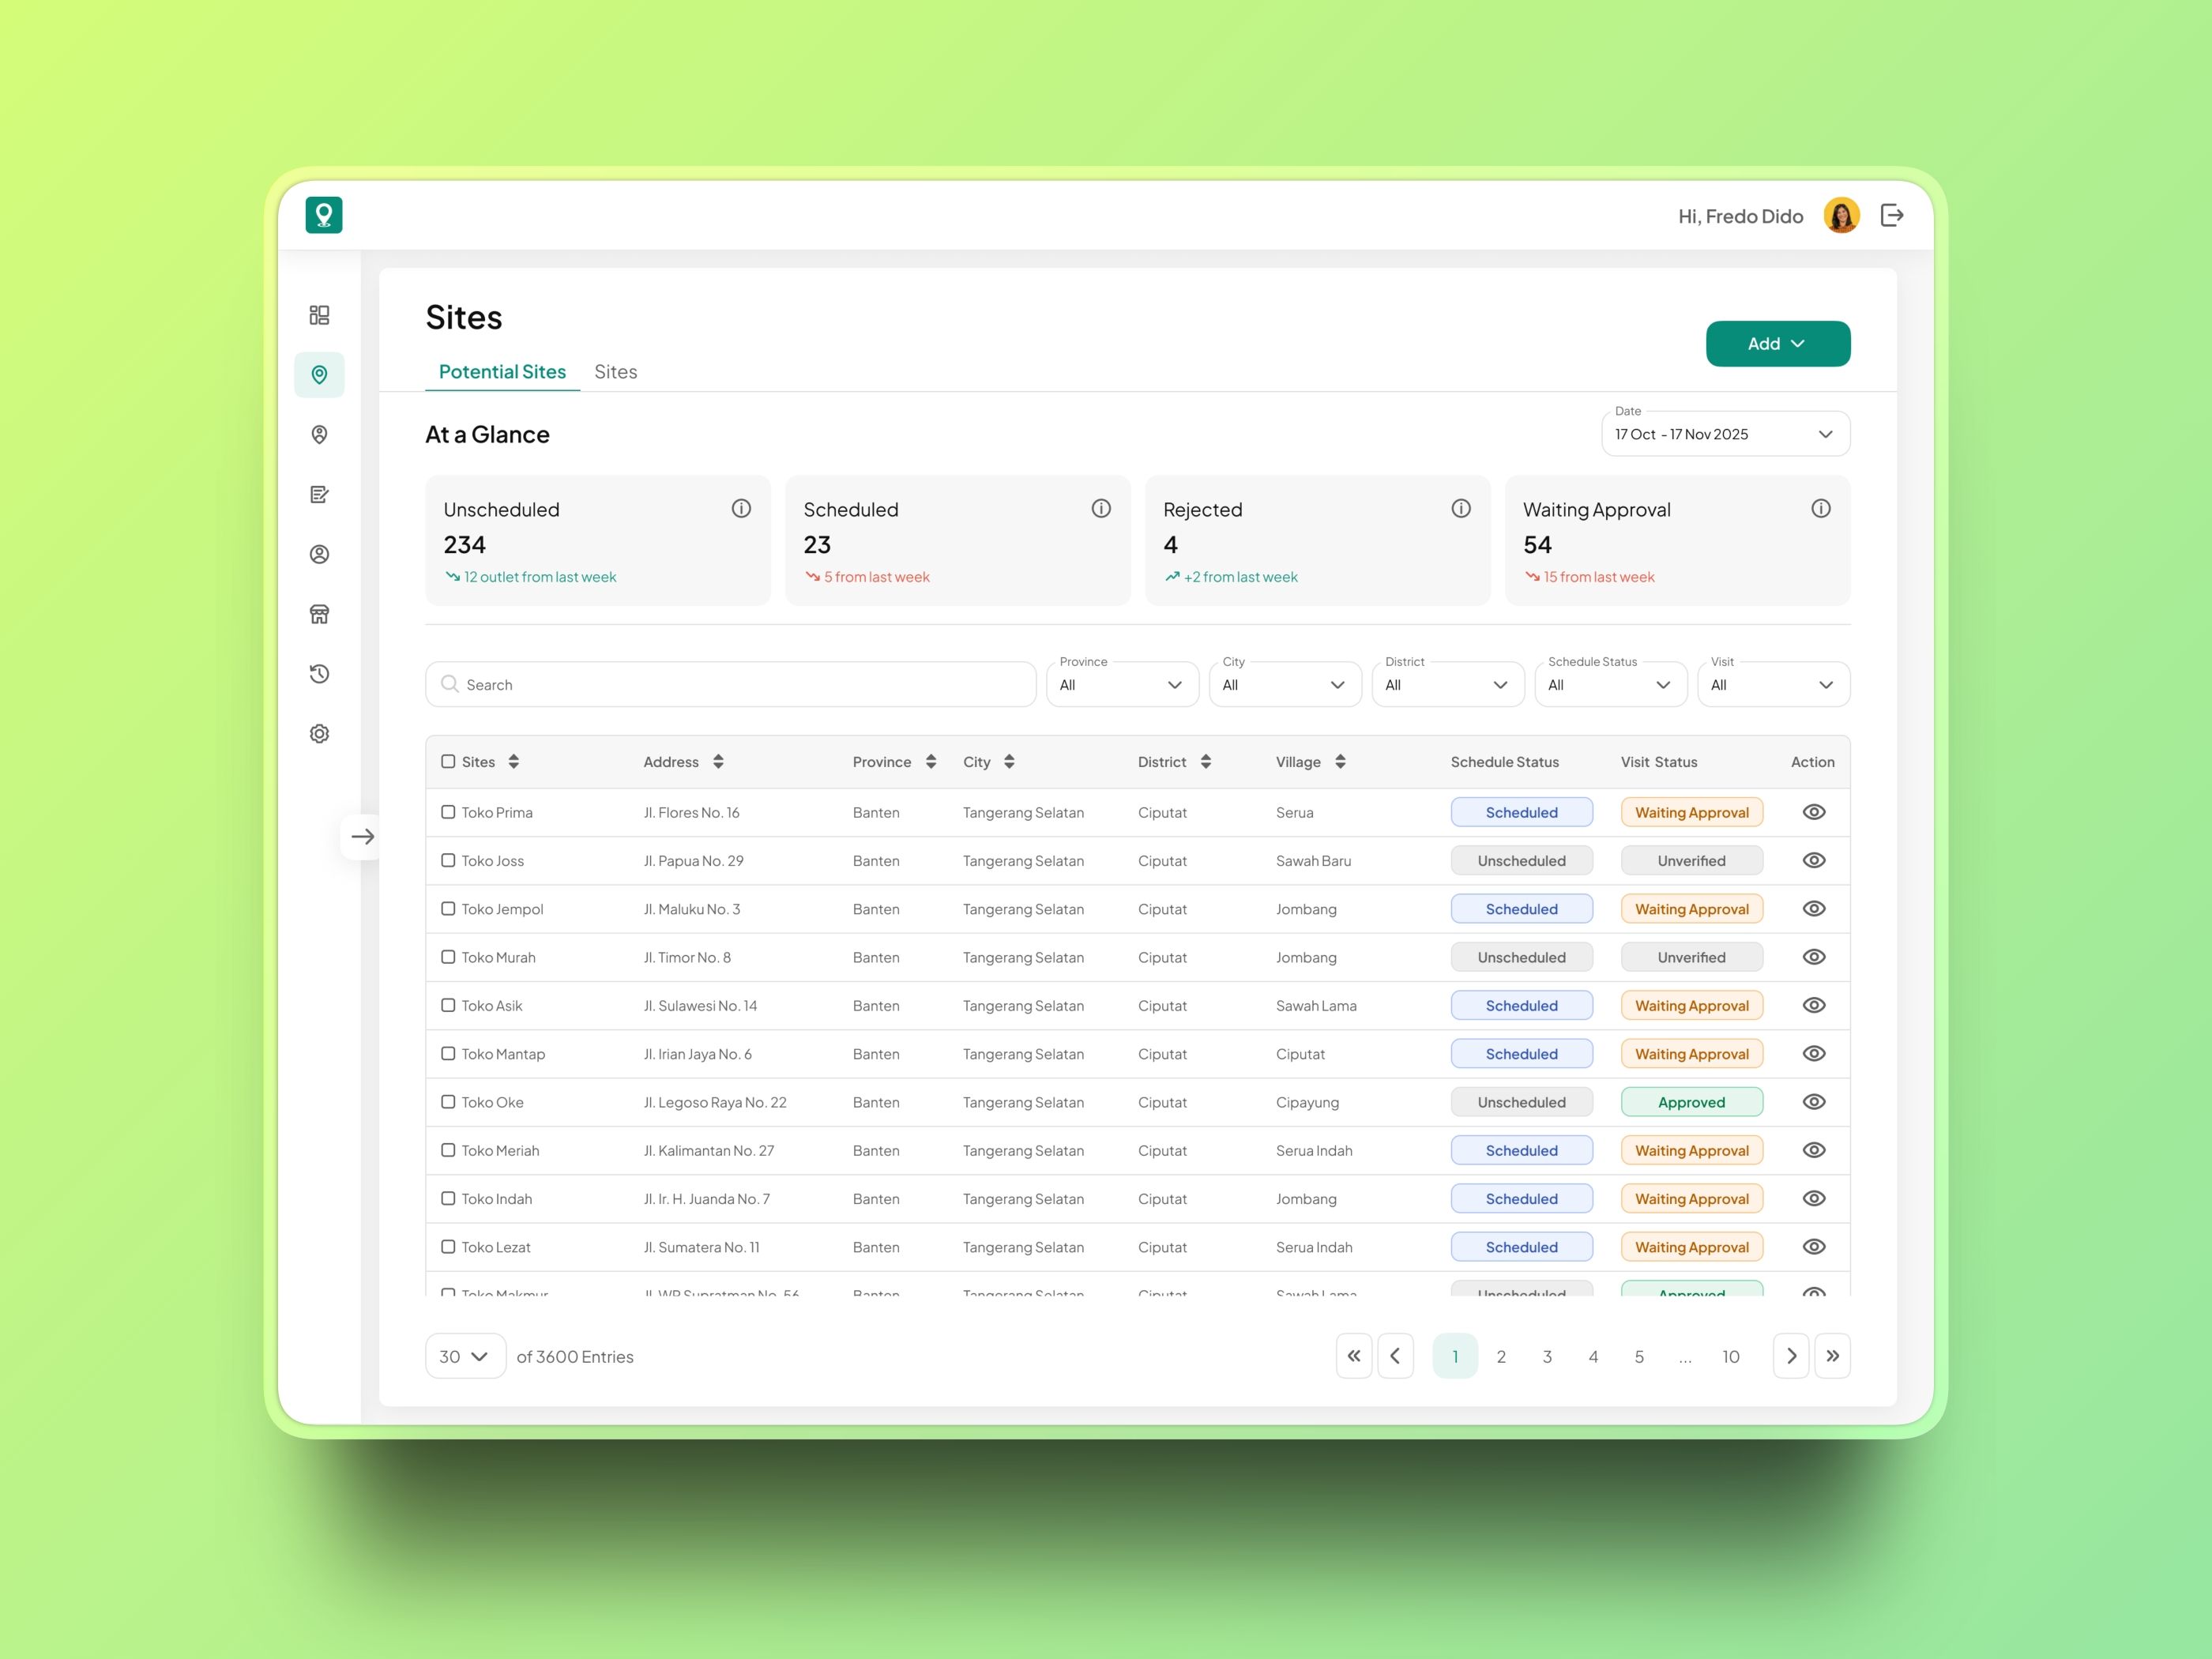
- Selecting one or many sites from a table or map.
- Saving an incomplete selection as a draft.
- Creating a plan for a field worker and visit date.
- Preventing duplicate planning for the same site.
- Showing partial success when only some selected sites can be assigned.
- Grouping sites assigned to the same worker on the same date.
- Restricting edits after field work has started.
- Filtering performance data by supervisor, field worker, and date period.
The aim was to make the system feel controlled in normal use while still helping users recover when real operational conditions change.
The Solution
Assignment
The Assignment experience allows supervisors and administrators to select sites, review them before committing, and create visit plans for their teams.
Users can select sites or potential sites from a table or a map. A floating selection state keeps the current batch visible across navigation, filtering, and pagination. Once users choose to assign the selected locations, a sidebar provides a final review before the plan is created.
The sidebar contains the selected sites, address, site type, planned date, and field worker. It gives supervisors enough context to catch mistakes before committing a large batch.
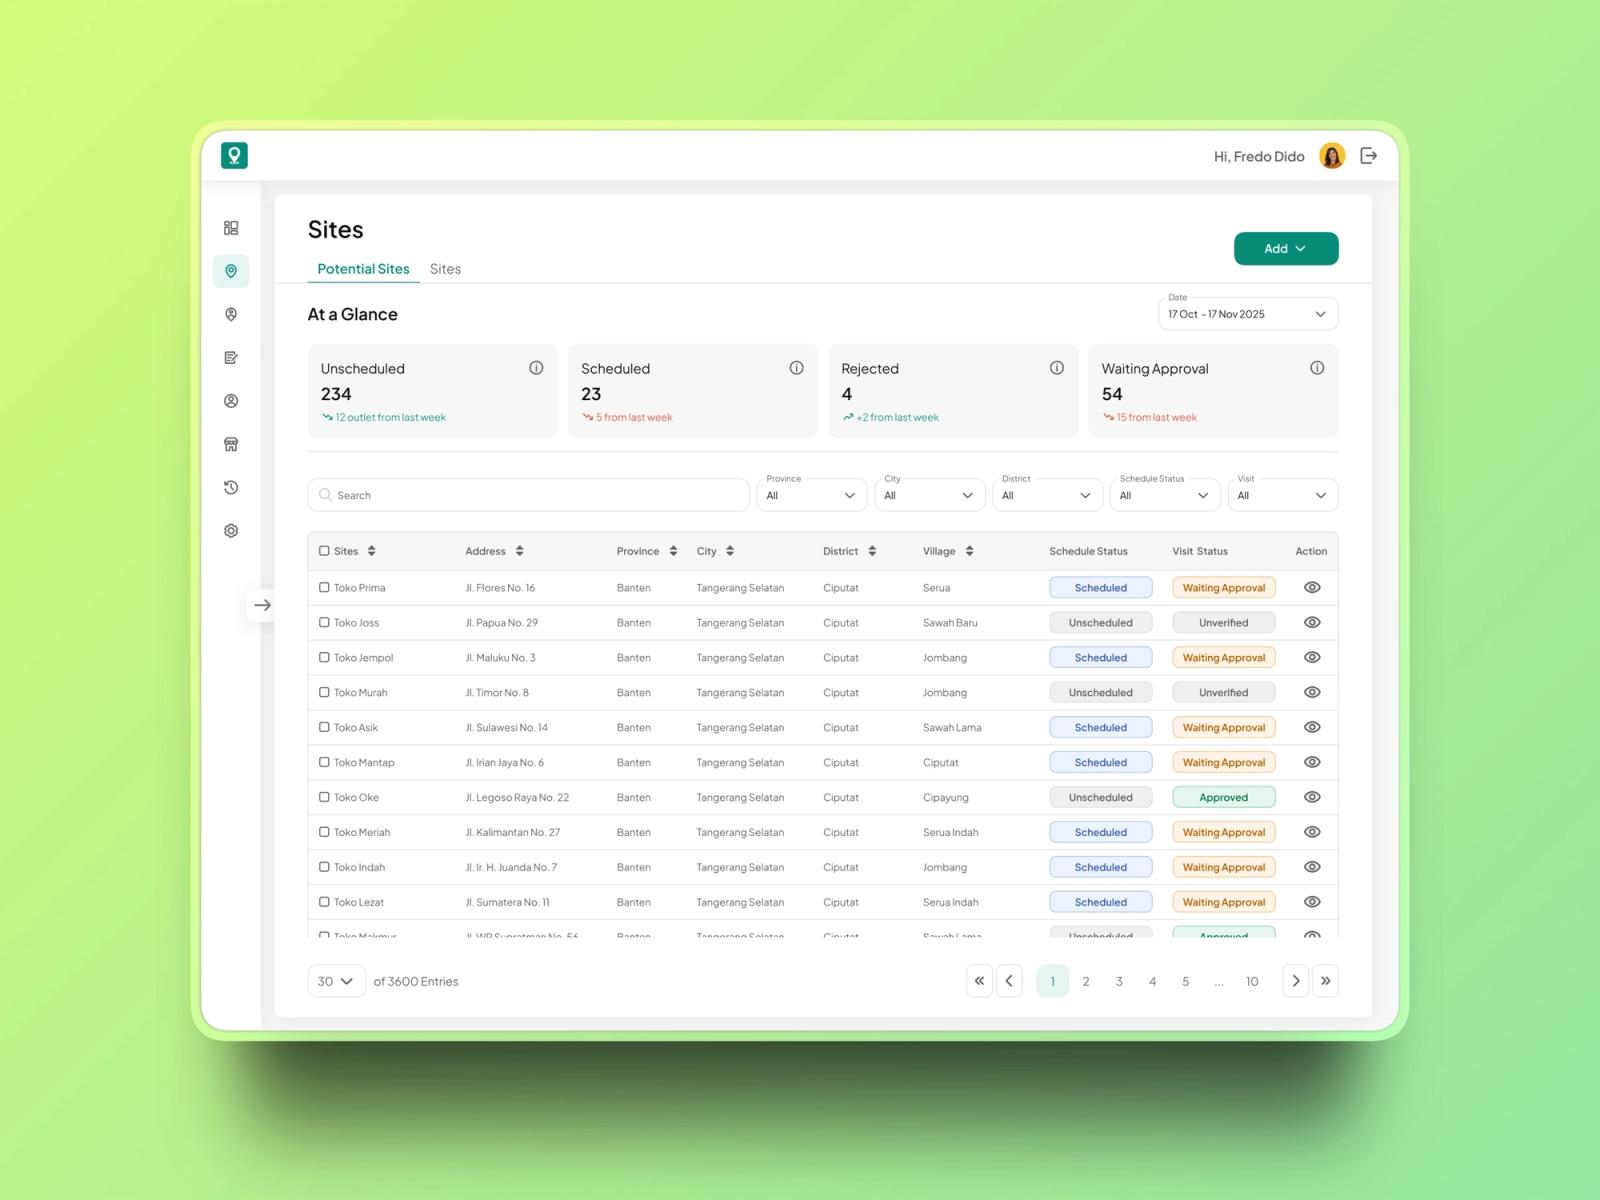
Drafts and planning states
Planning does not always begin with complete information. A supervisor may identify sites that require attention before knowing the exact date or available field worker.
To support this, I designed an assignment lifecycle:
- Draft — sites are saved, but the plan is incomplete.
- Planned — field worker and visit date are confirmed.
- In Progress — a field worker has started a visit.
- Completed — the visit record has been finalized.
These states also define the editing rules. Draft and planned records can be updated. Once work is in progress or complete, the system protects the record from broad changes to preserve operational integrity.
Groups and bulk actions
When a supervisor assigns several sites to the same field worker on the same date, those sites become an assignment group.
This lets users rebalance workload efficiently. They can change the assigned field worker or shift the visit date for a whole group in one action, instead of editing every site manually.
However, the design preserves individual control. If a group is already in progress, sites that have not yet been visited can still be adjusted individually when necessary, while active or completed sites remain protected.
Conflict handling
The experience was designed to prevent planning conflicts without forcing users to restart their work.
For example, when a supervisor selects ten sites but three already have a visit on the selected date, the system can save the seven valid sites and clearly identify the conflicting entries. The user can then remove those sites or update the plan directly from the same context.
This makes the error actionable and preserves the supervisor’s work.
Dashboard
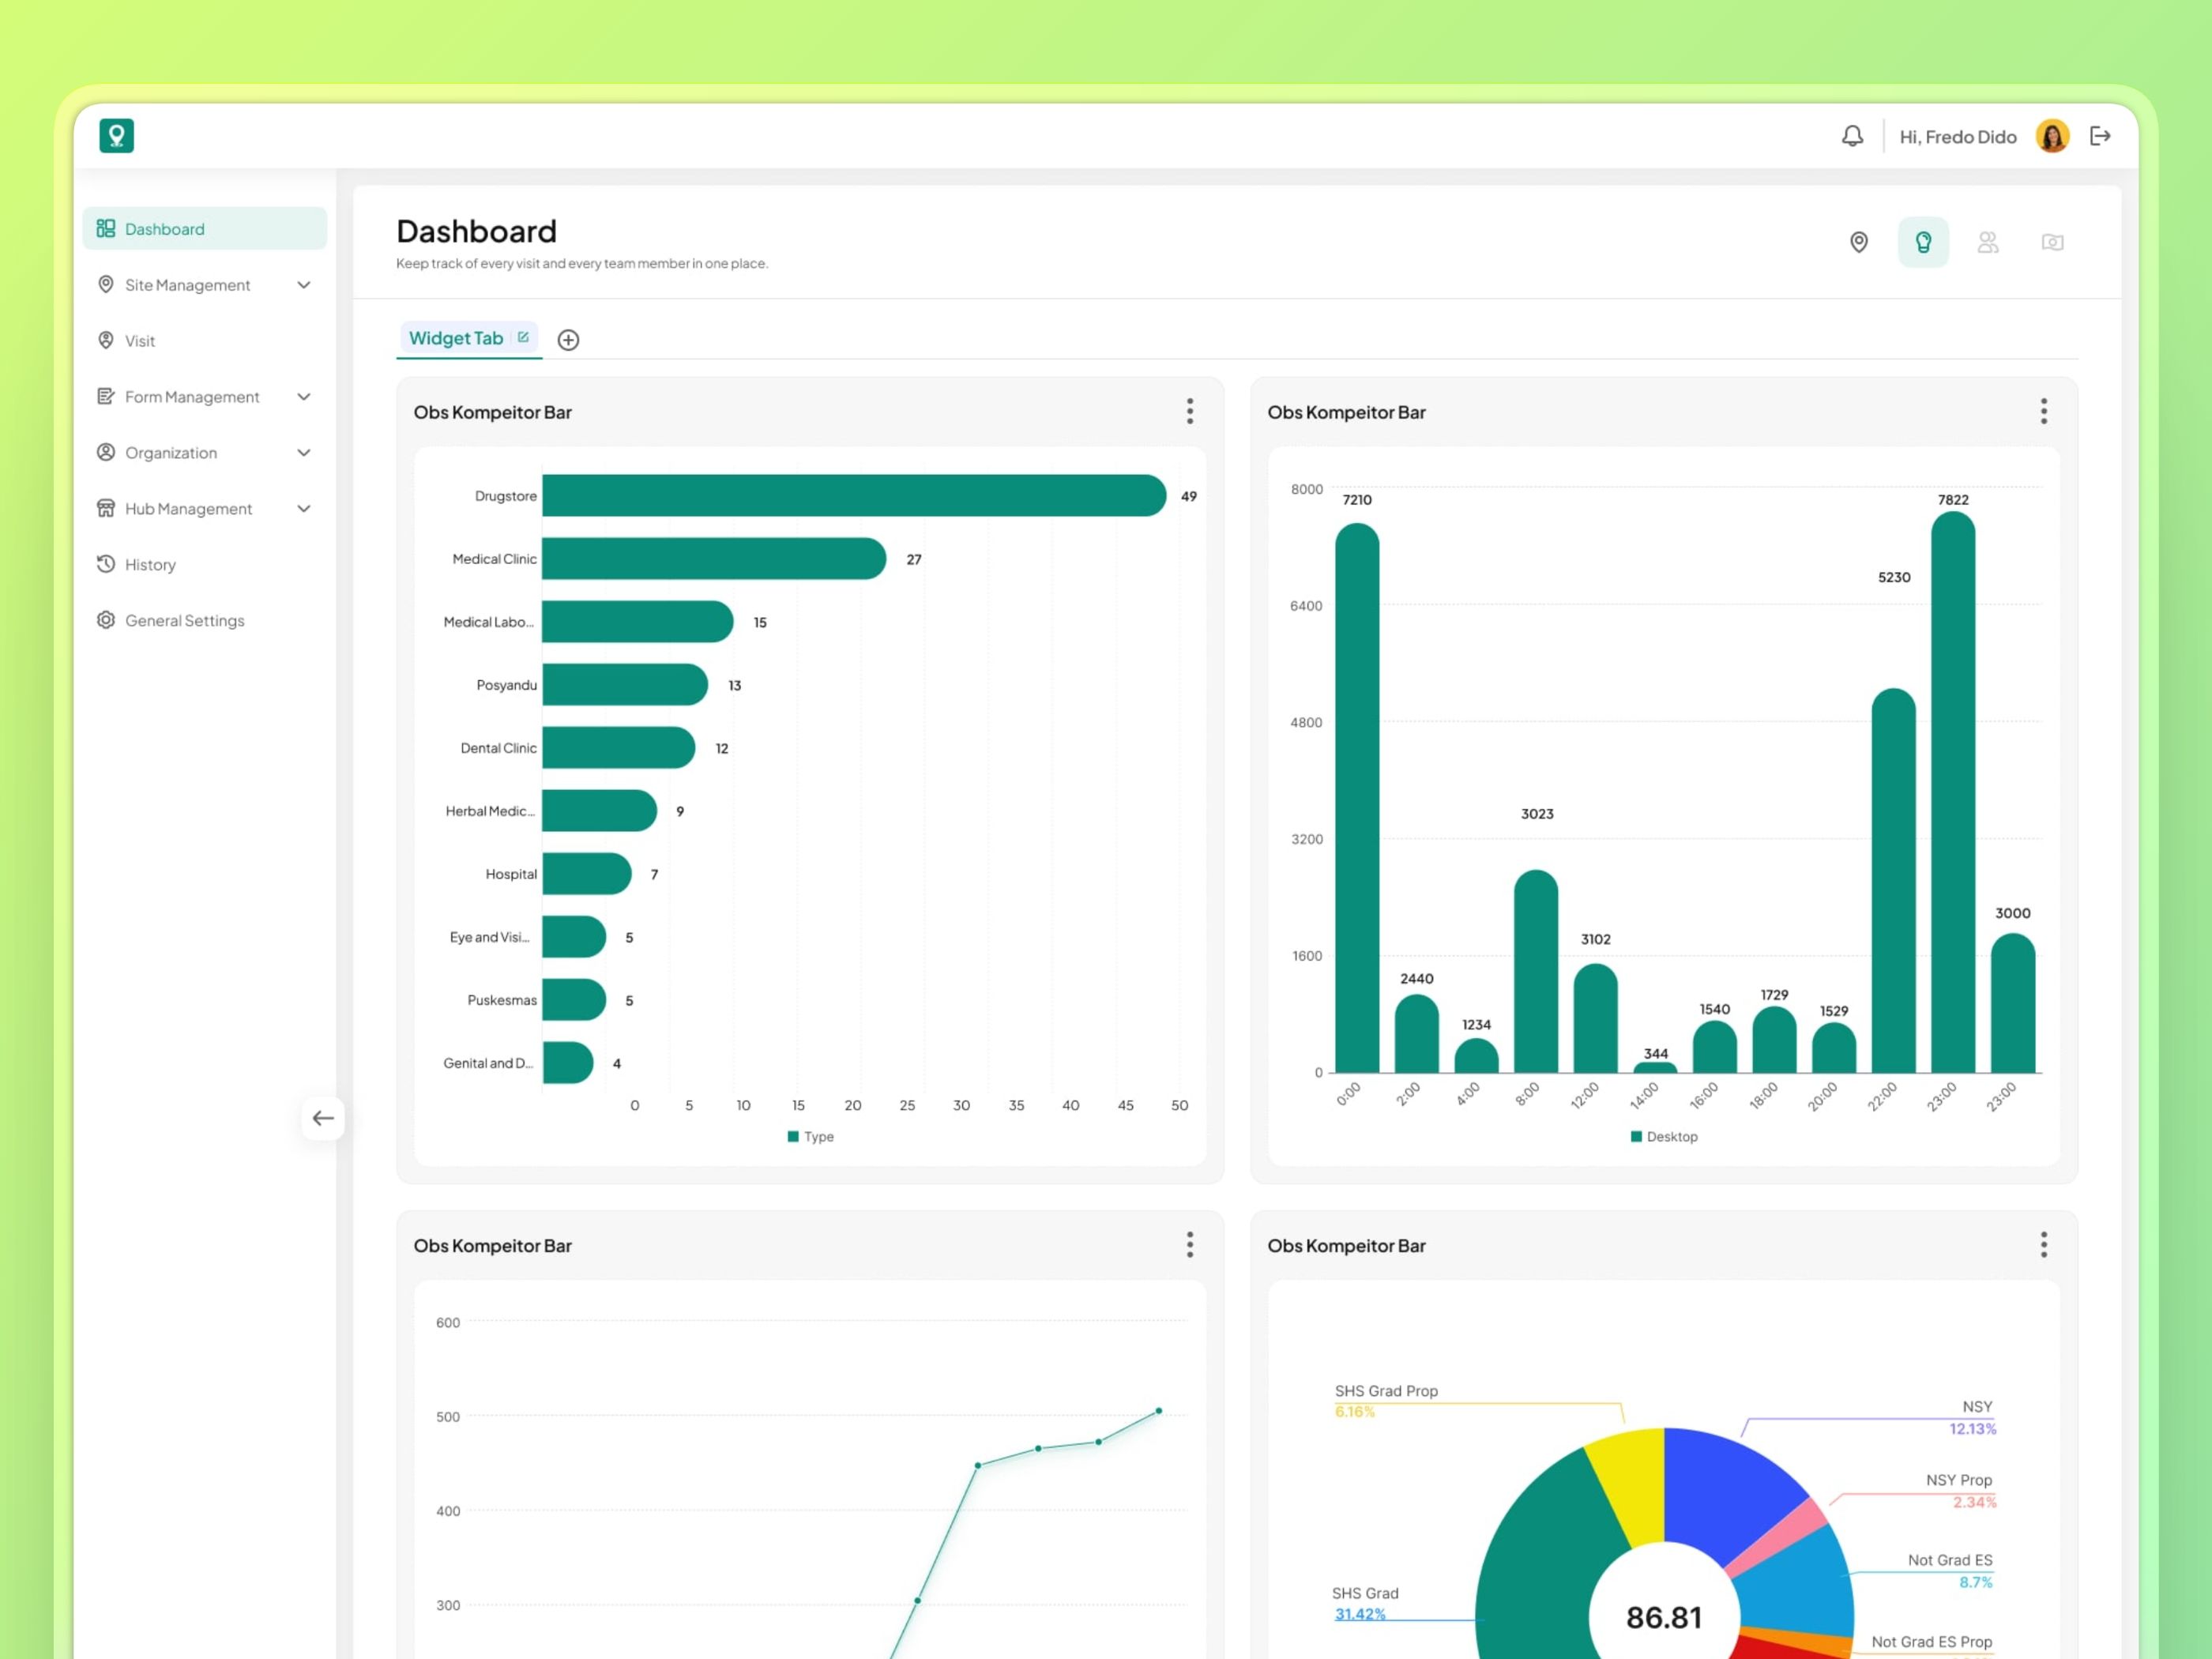
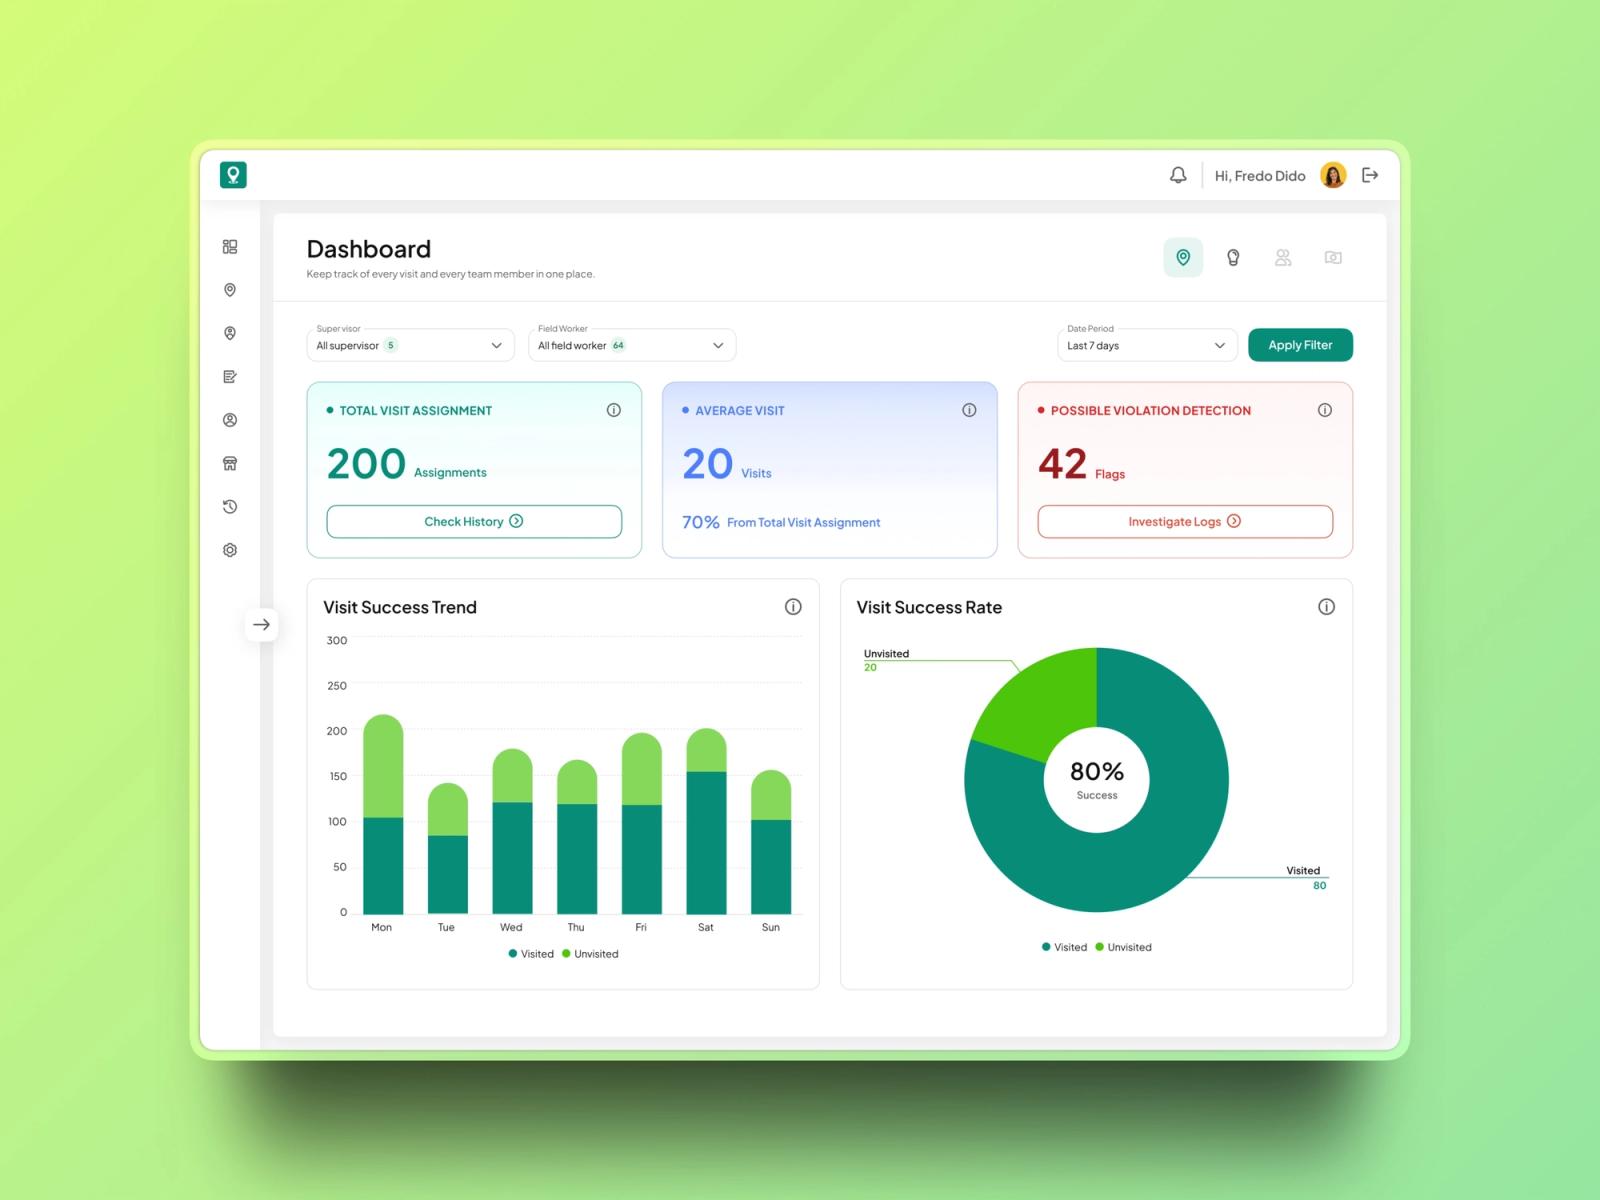
The Dashboard brings together the operational signals needed after a plan has been created.
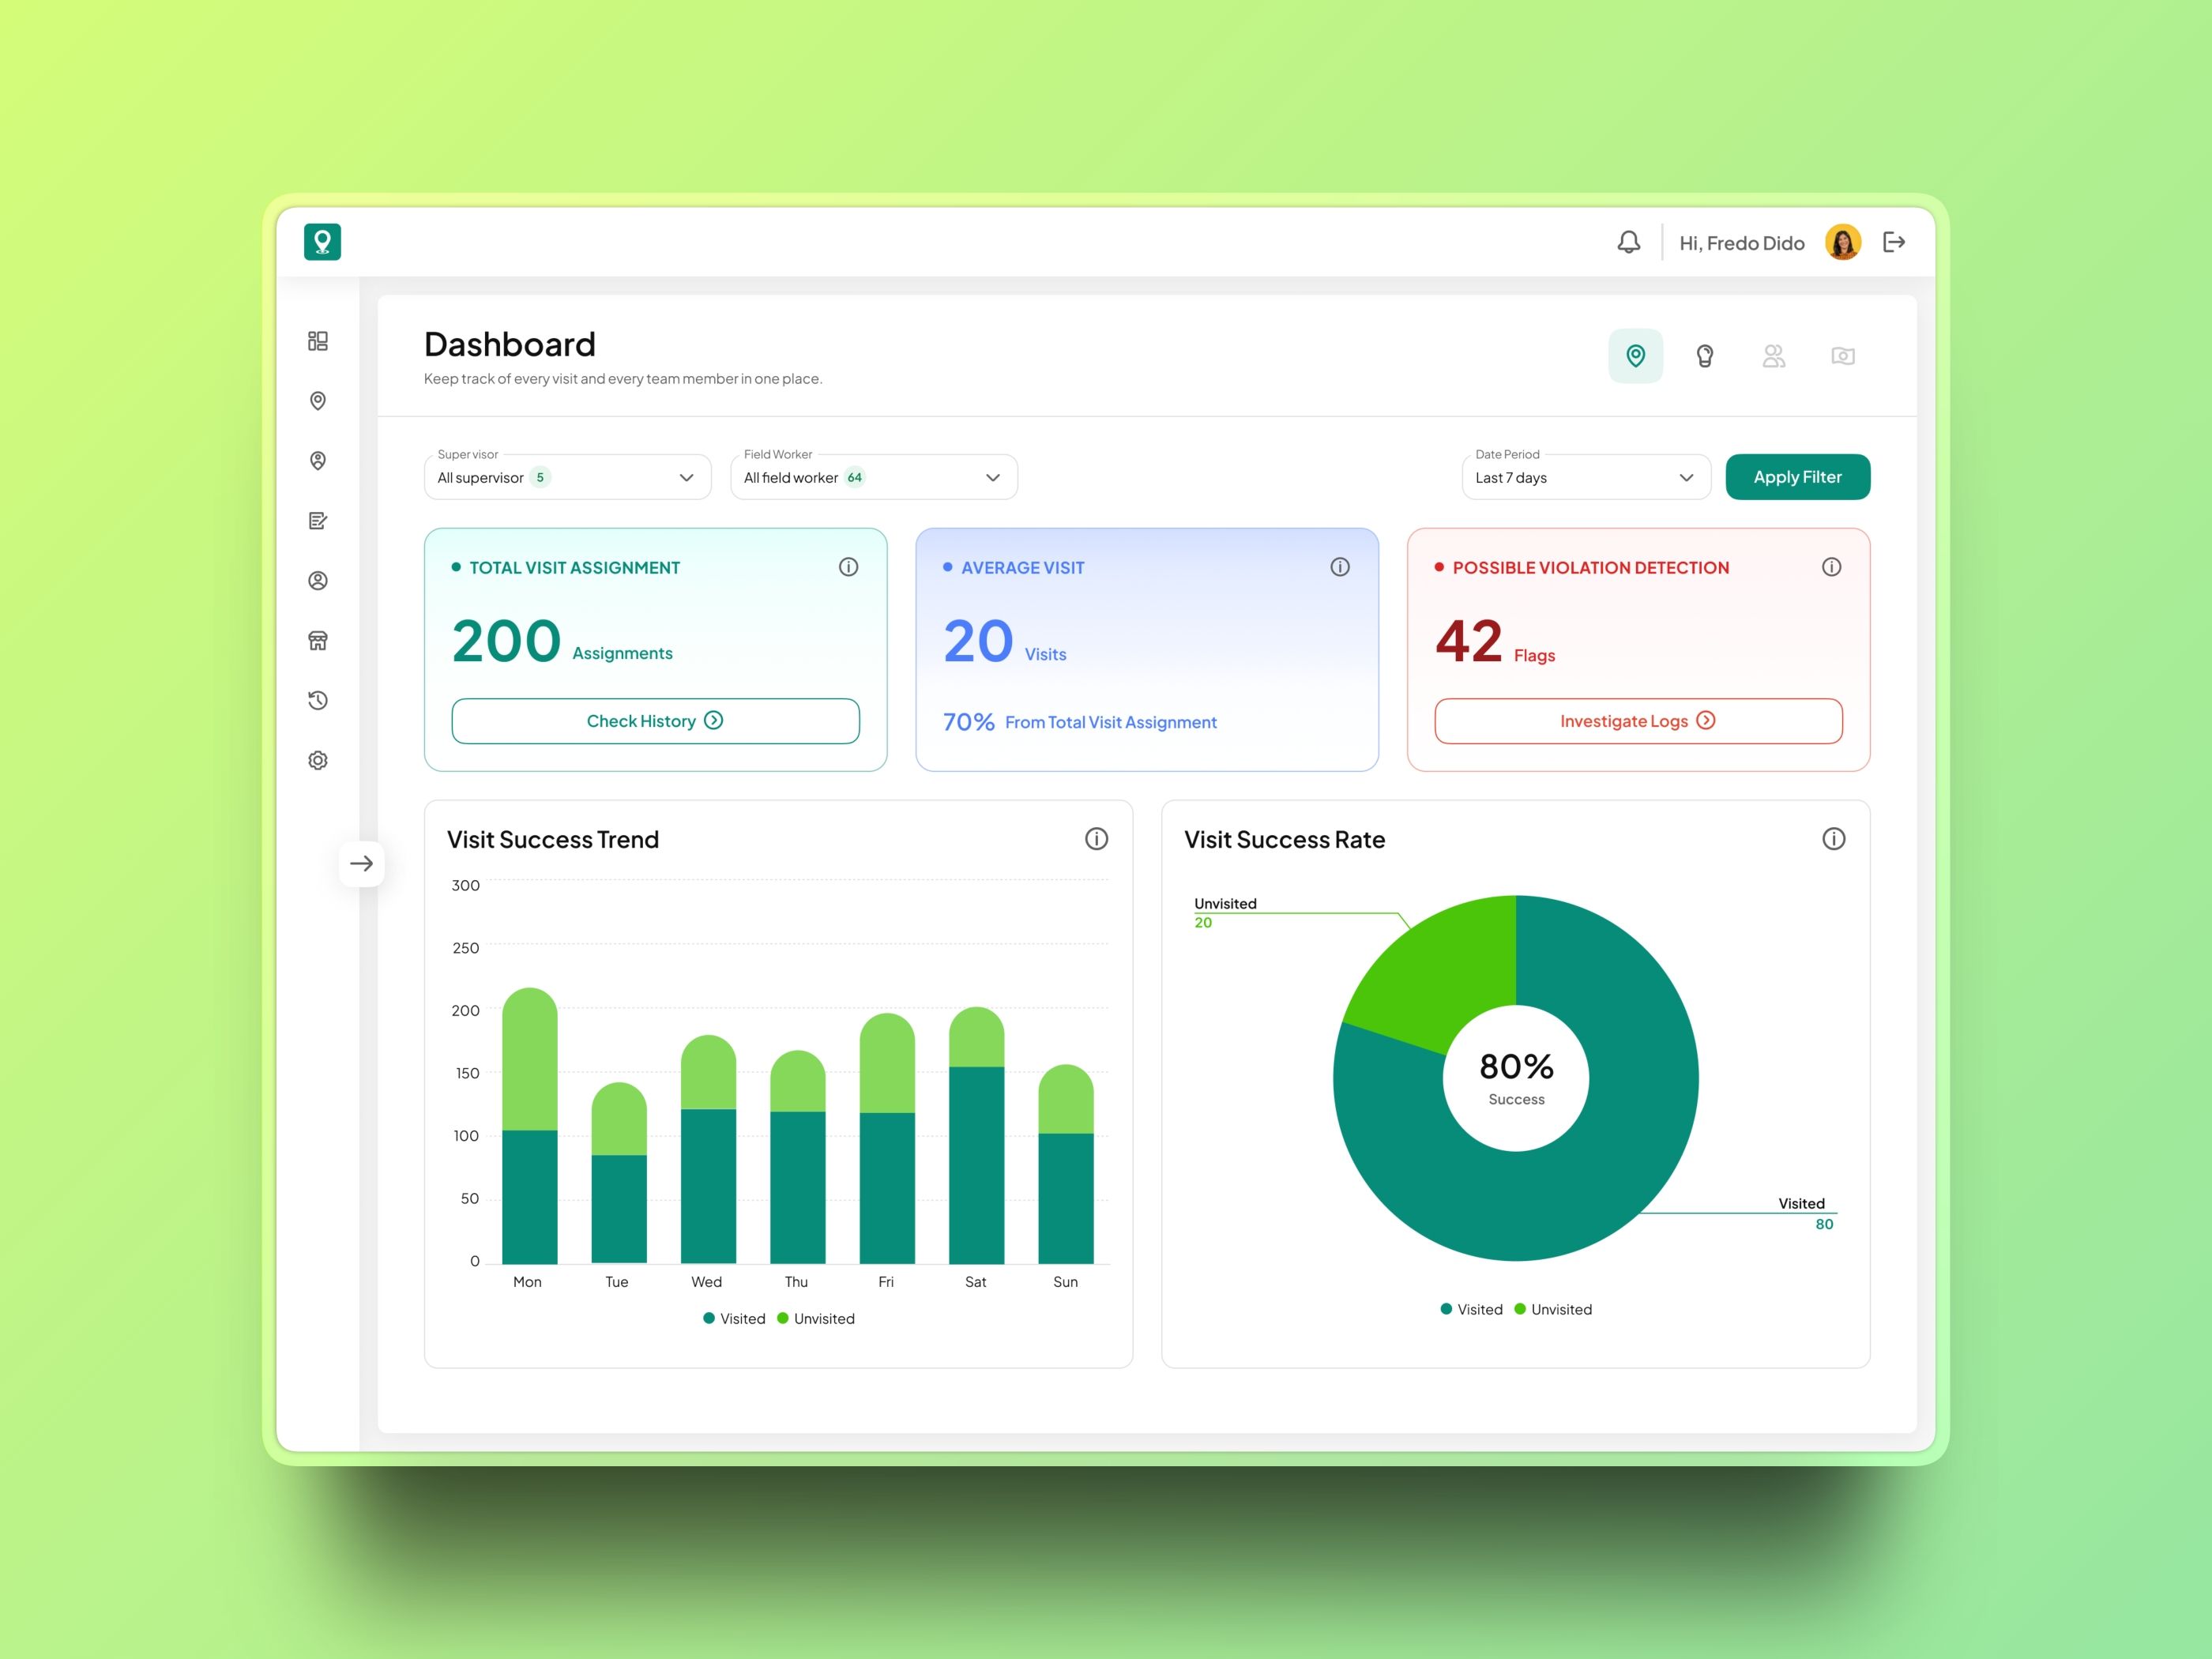
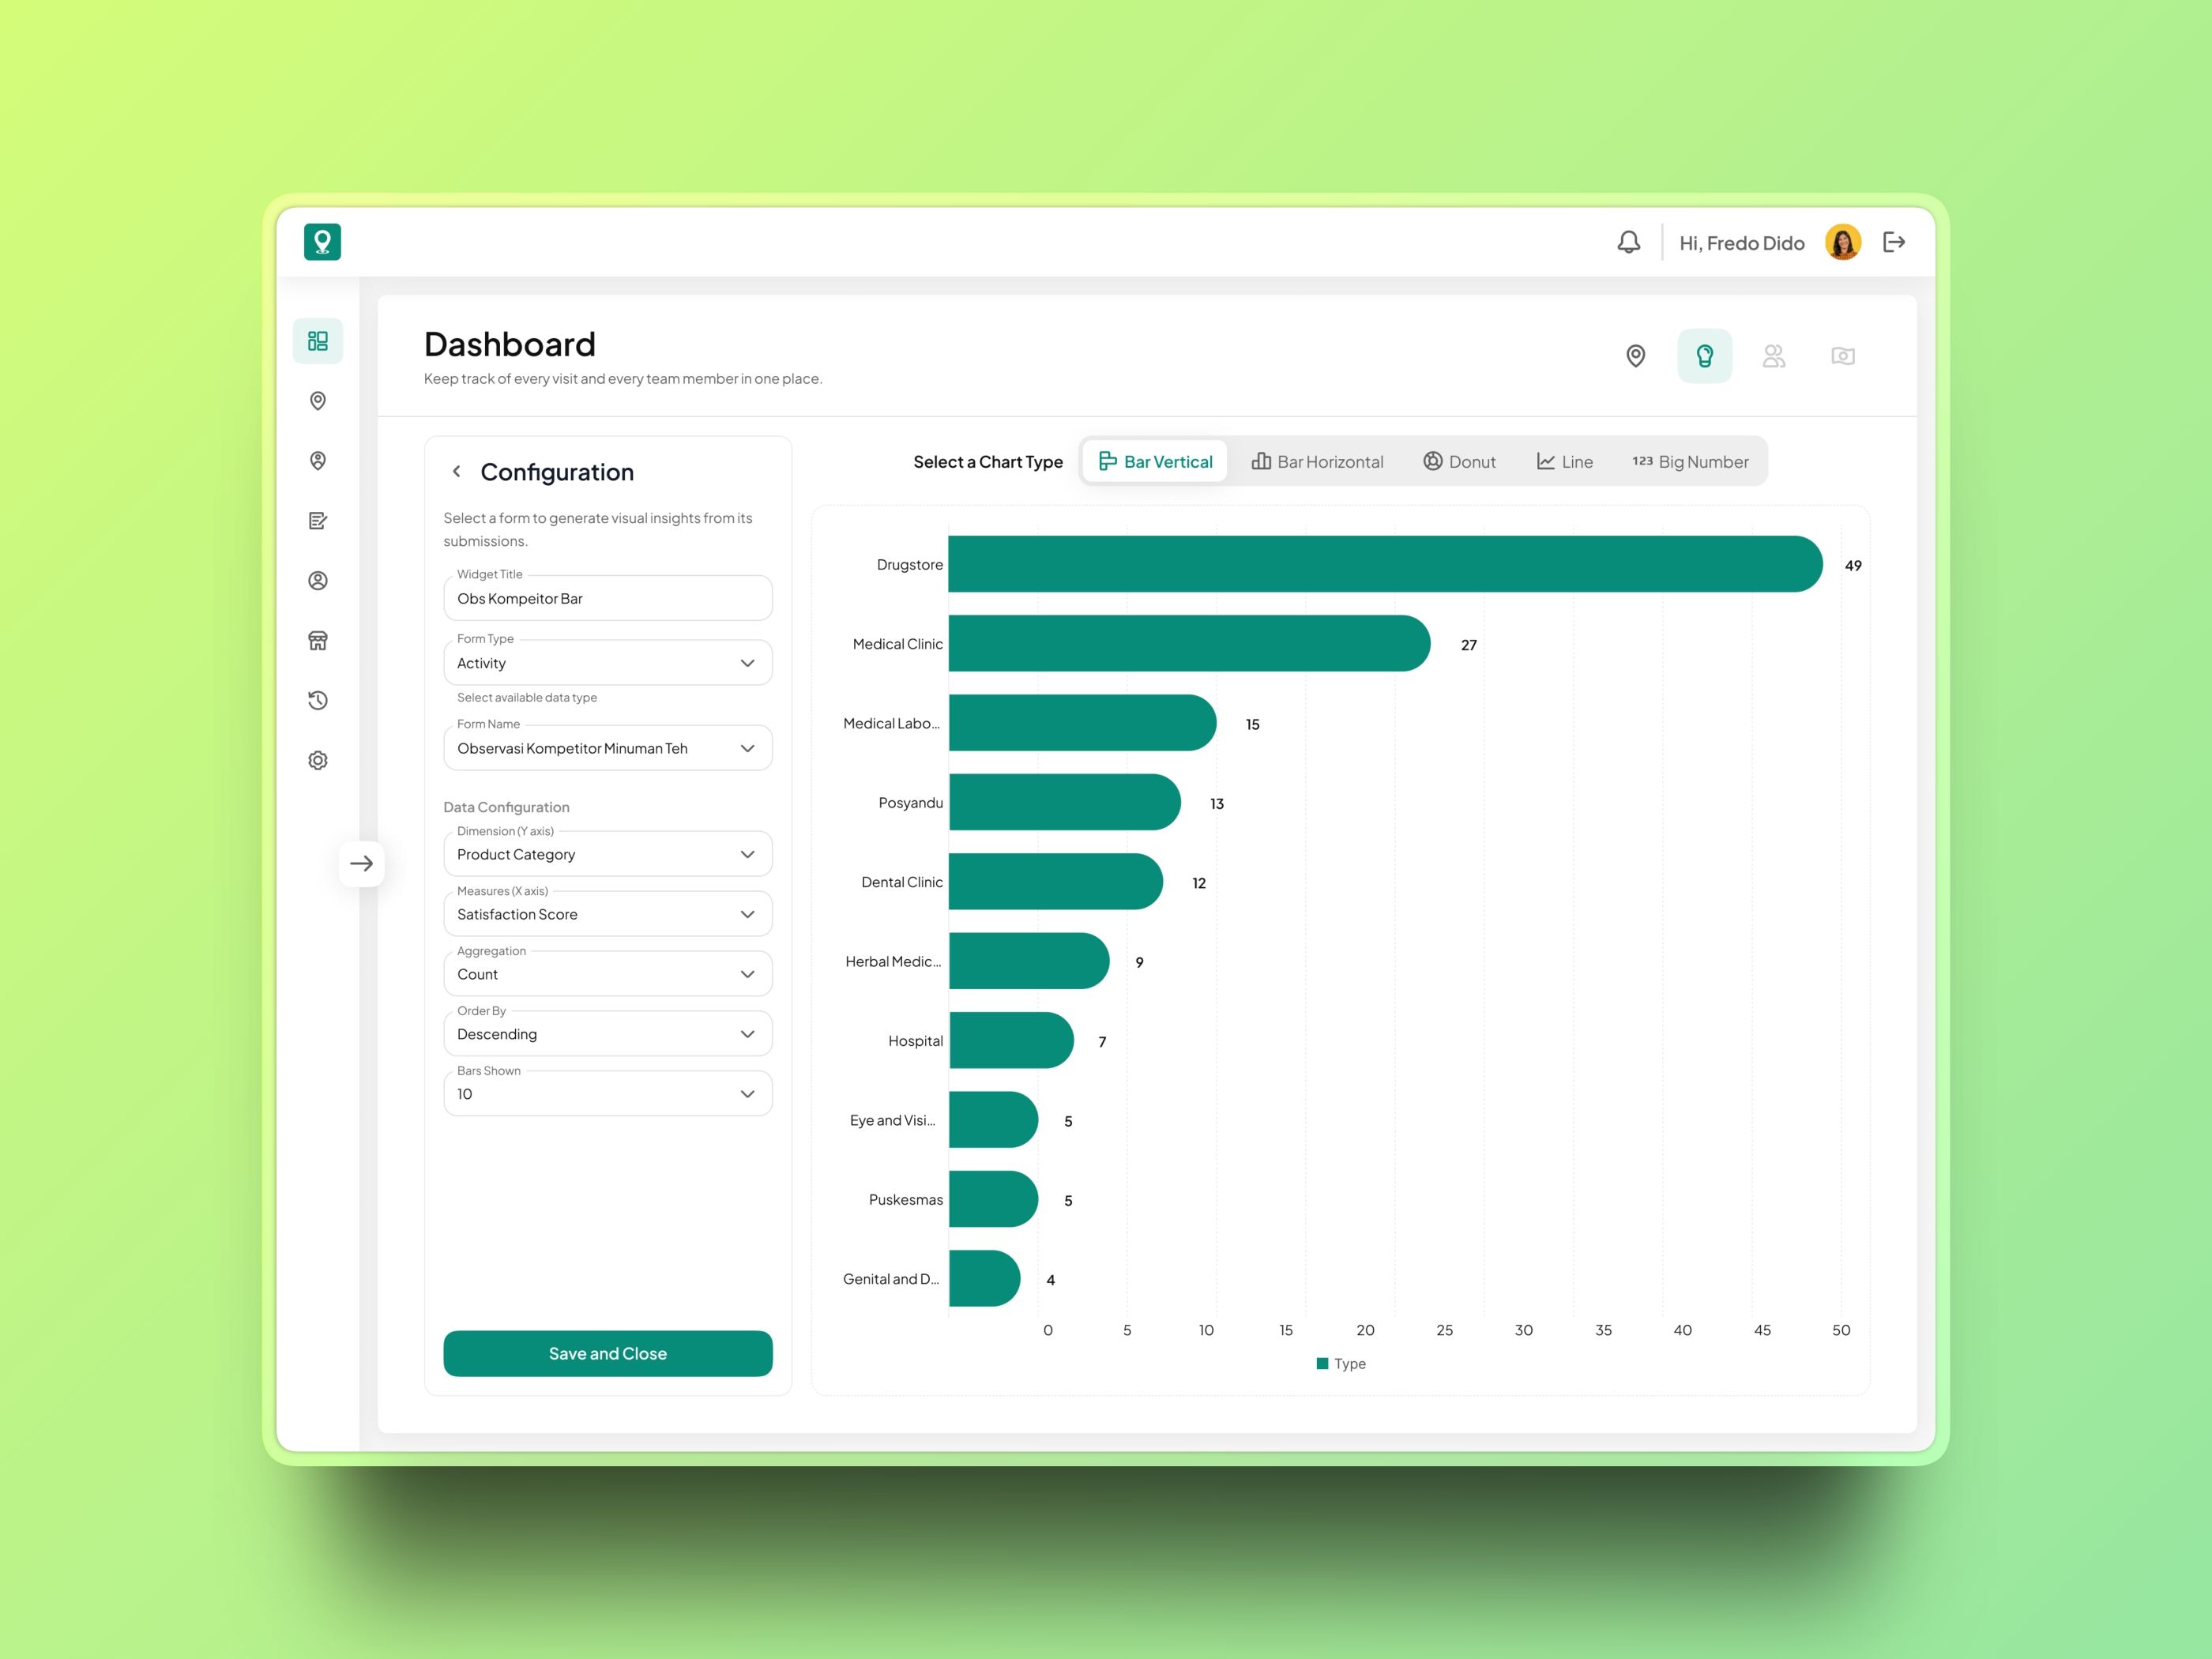
Supervisors and administrators can filter data by supervisor, field worker, and time period. All dashboard widgets respond to the same filter context, creating a consistent view of team performance.
The core metrics include:
- Total assignment visits.
- Average visit performance.
- Visit success rate.
- Daily or weekly visit success trend.
- Completed versus missed visits.
- Possible fraud or location violations.
The dashboard distinguishes between activity and compliance. A field worker may be highly active, but visits outside the planned assignment should not increase the team’s assignment success rate. This keeps the reporting aligned with the original operational plan.
Designing for investigation
The Dashboard was designed to support action, not only reporting.
Possible location violations are surfaced as a dedicated signal, helping managers identify visits where check-in coordinates may fall outside a site’s expected geofence. From there, they can investigate the related record and understand the situation in context.
Likewise, the visit trend reveals when completion drops or unvisited assignments increase over time—giving supervisors a starting point to investigate workload, scheduling, or field execution issues.
Functional Prototype
I created a functional coded prototype to test the key Assignment and Dashboard workflows beyond static screens.
The prototype covered Assignment list behaviour, filtering, visit status, dashboard metrics, and the relationship between planning and monitoring. It became a practical artefact for discussing interactions, validating requirements, and aligning product and engineering teams.
Outcome
This work established a clearer operational model for Targetin.
Supervisors can move from site selection to visit planning with more confidence, while managers gain visibility into completion, workload, and potential compliance issues through a connected dashboard.
The design also created a shared language for the team around assignment groups, status lifecycle, hierarchy-based permissions, scheduling conflicts, and field performance.
As Targetin continues to evolve, this case study focuses on the product decisions, interaction patterns, and implementation-ready direction rather than publishing business metrics.
See Targetin in action
Explore the live experience or return to the full project archive.